SalesPulse Analytics
 React firebase Tailwind CSS Recharts
 The Data Visibility Challenge
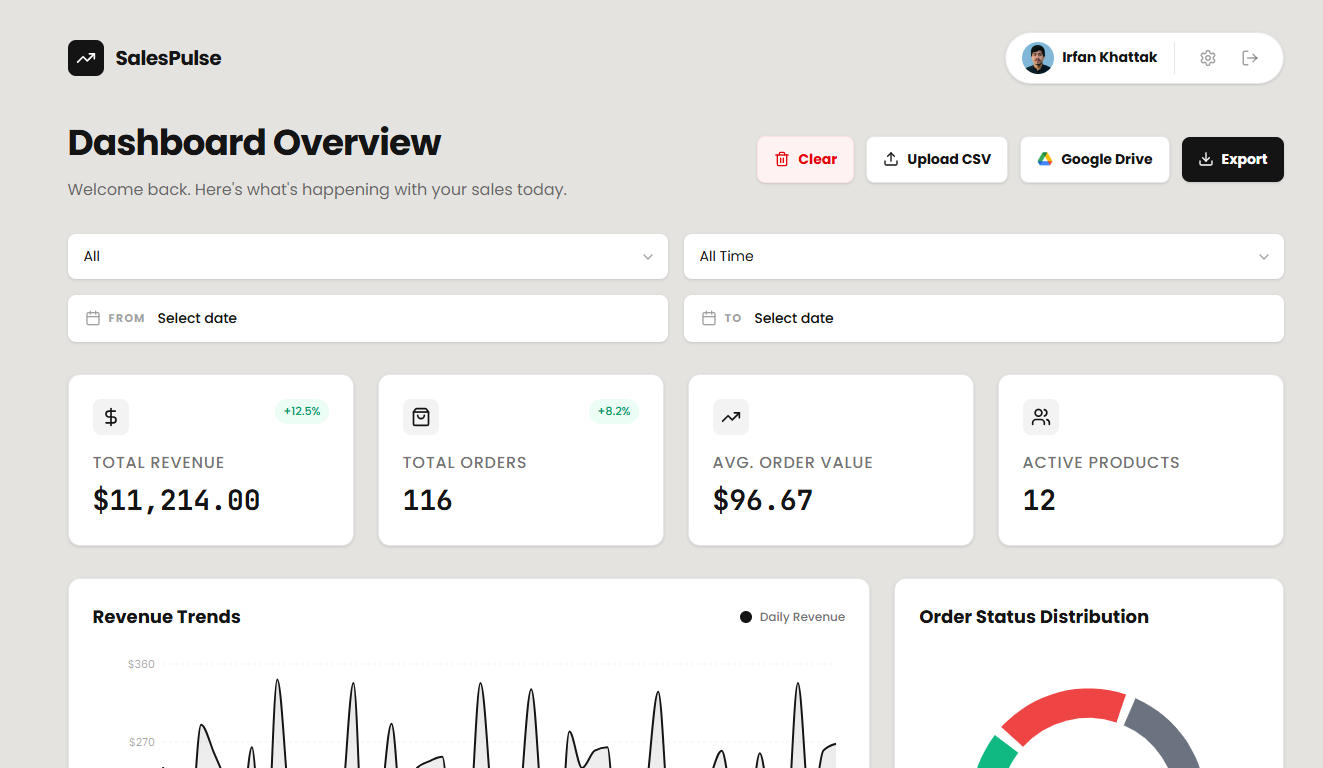
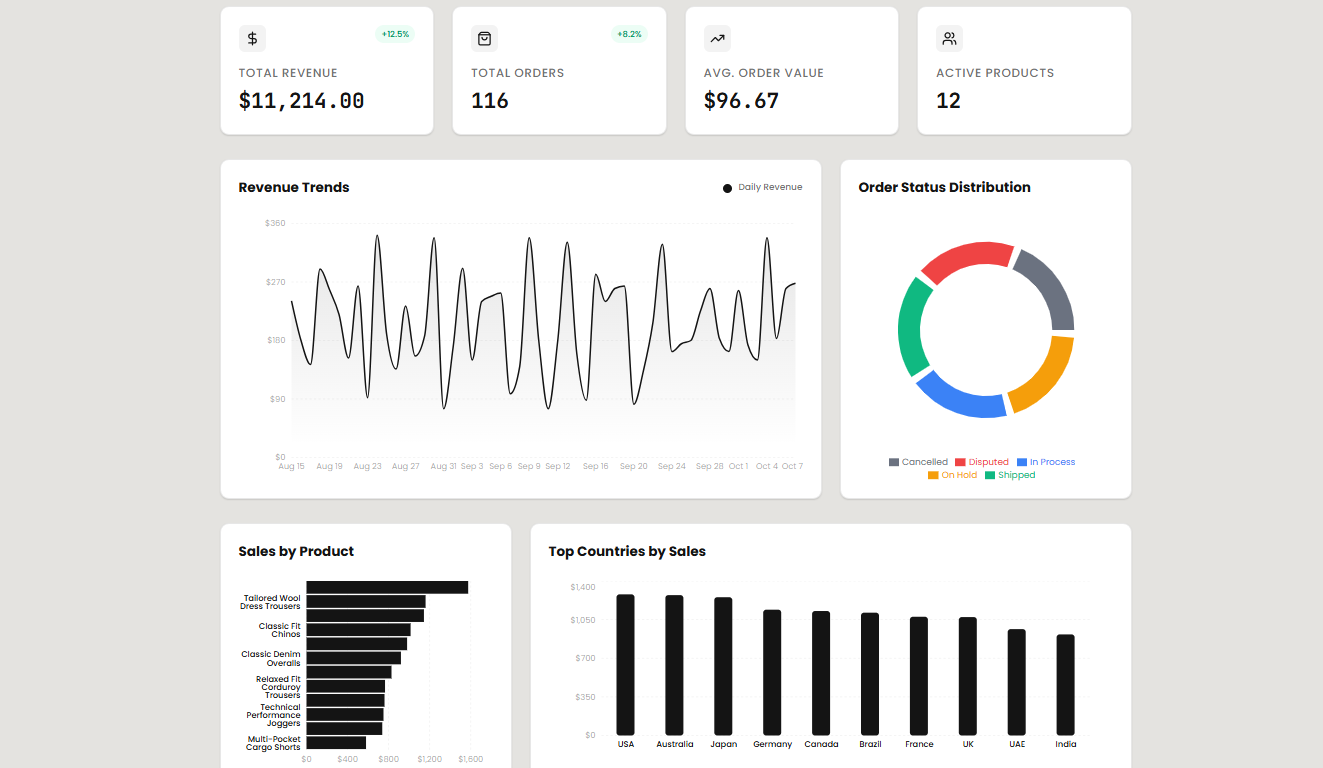
Modern enterprises generate massive amounts of transactional data, but without proper visualization, that data is useless to stakeholders. SalesPulse was engineered to solve the "data silo" problem by providing a centralized, real-time command center for monitoring business health, product velocity, and revenue streams.
Real-Time Event Architecture
Built on a modern frontend stack using React 19 and Vite, the application prioritizes speed and seamless state management.
Bypasses slow API polling by subscribing directly to NoSQL document changes. The UI updates the exact millisecond a transaction occurs.
Utilizes Recharts and Framer Motion to render fluid, interactive data visualizations that allow users to slice metrics by custom date ranges.
Enforces Firebase Authentication and strict Firestore Security Rules, ensuring users can only read/write their specific organizational data.
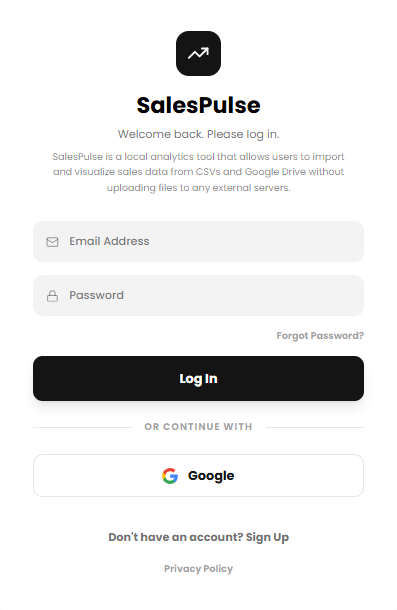
Zero-Trust Authentication Pipeline
Before accessing the live organizational data streams, users must pass through a strict, multi-layered identity gateway. The system leverages Firebase Authentication augmented with a custom 4-digit email verification protocol. This ensures that only fully verified stakeholders can access the metrics, completely neutralizing unauthorized data exposure.
Interactive Data Engine
Experience the fluid visualization logic firsthand. The engine below demonstrates how raw organizational data streams are parsed into high-velocity, animated product trends.